You’re gonna plotz!

Ranae Dietzel & Andee Kaplan

You’re gonna plotz!

ggplot2

#install ggplot2 if necessary and load the package
if(!("ggplot2" %in% installed.packages()[, "Package"])) 
  install.packages("ggplot2")

library(ggplot2)

Histogram

#histogram
qplot(data = diamonds, price)
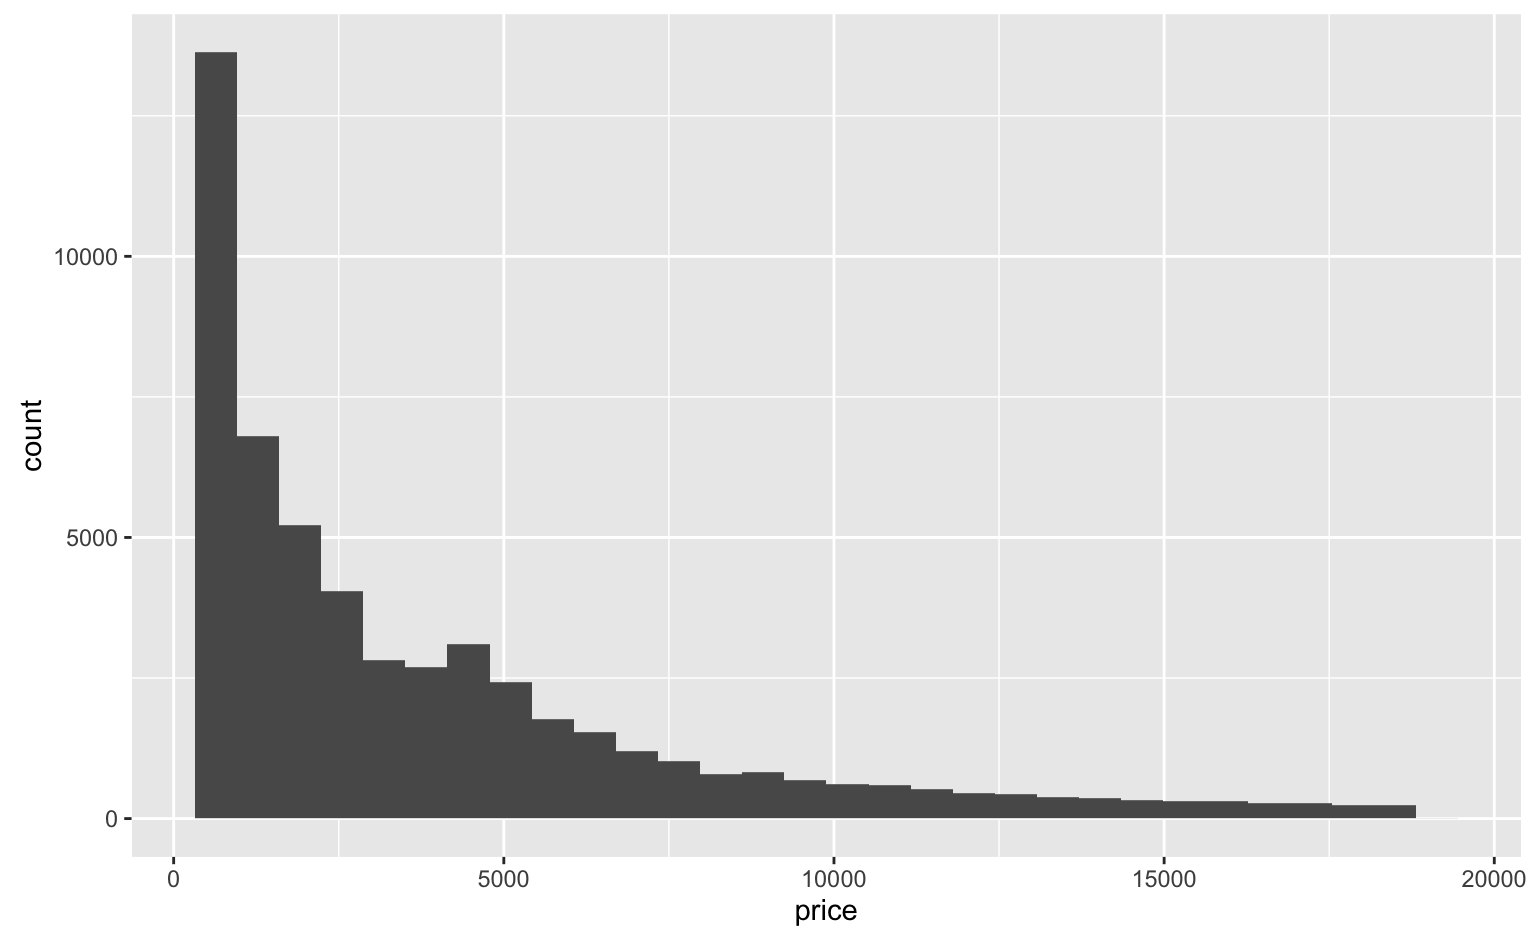
Scatter plot

#scatter plot
qplot(data = diamonds, carat, price)
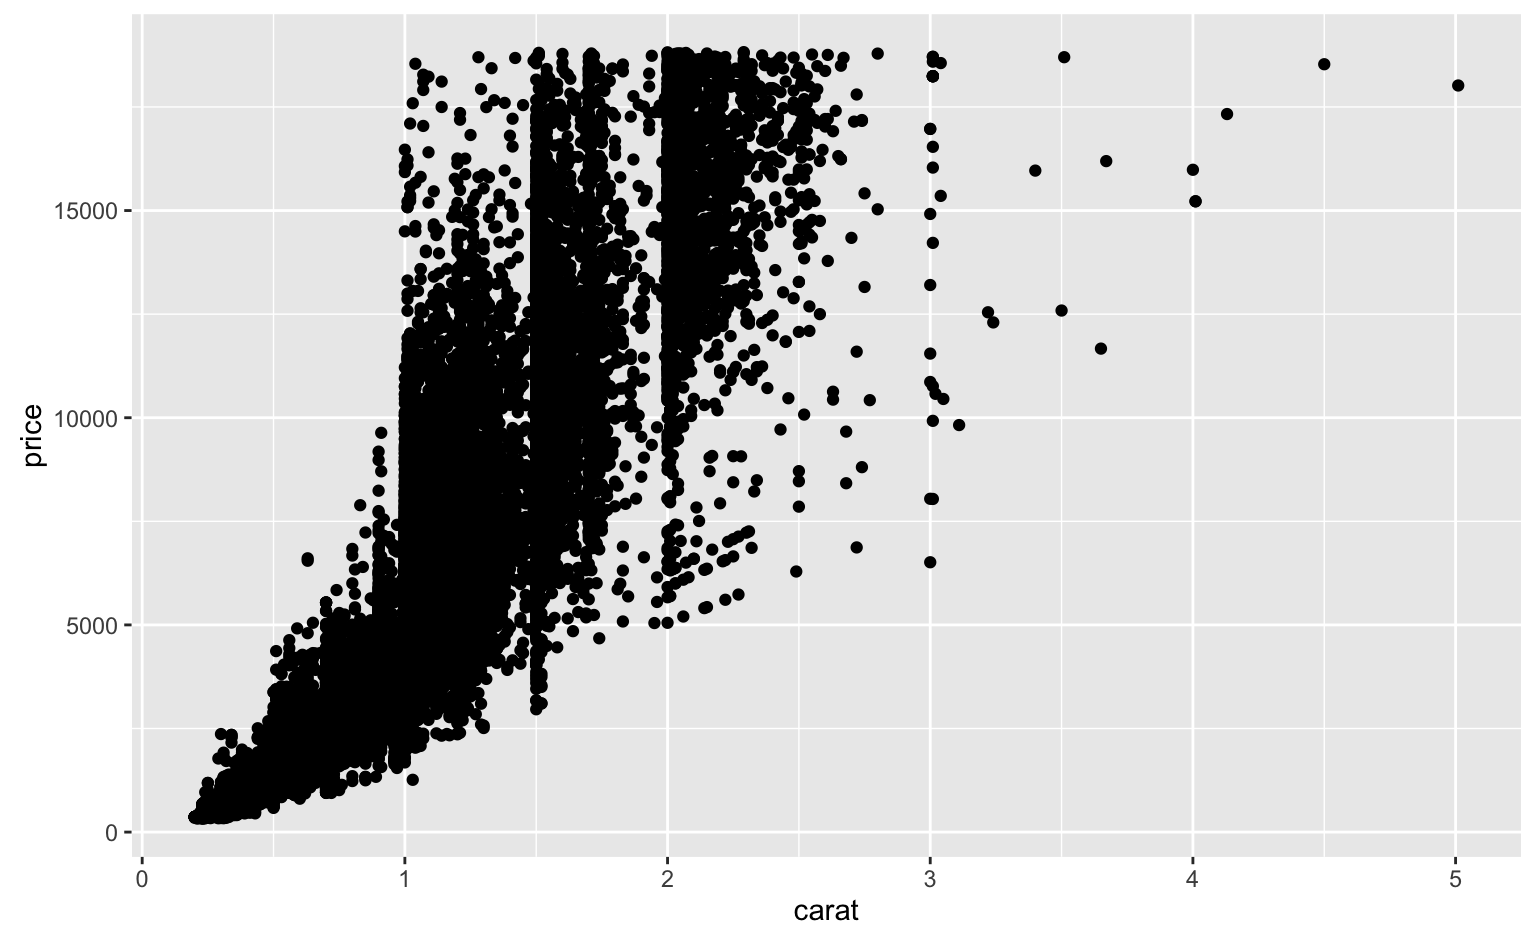
Boxplot

#boxplot
qplot(data = diamonds, color, price, geom = "boxplot")
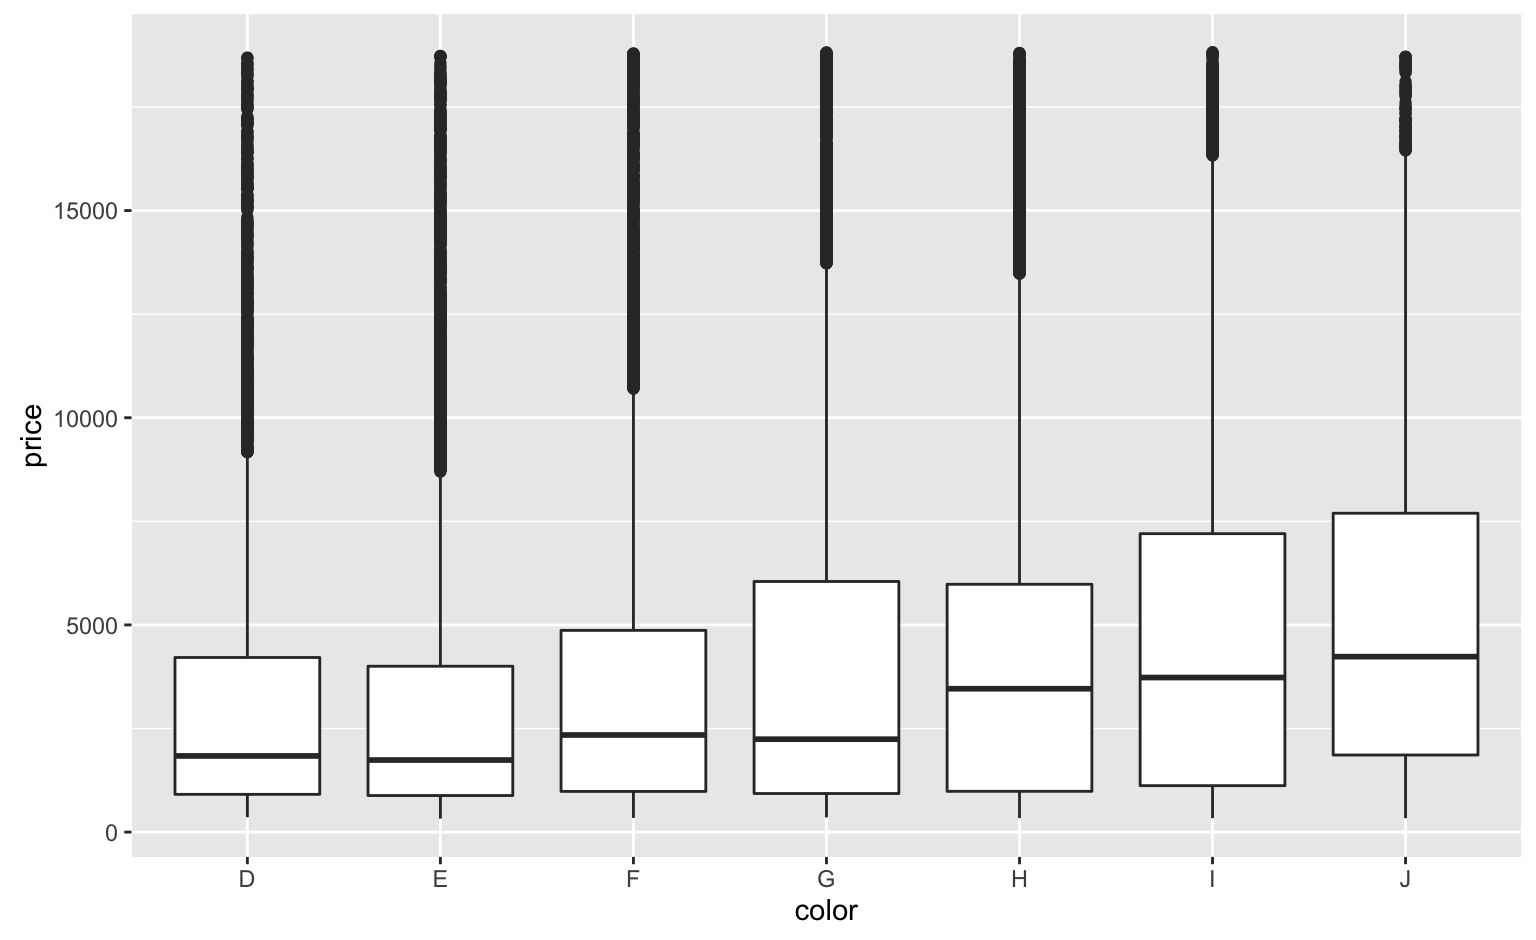
Adding color

#add color
qplot(data = diamonds, carat, price, colour = color)
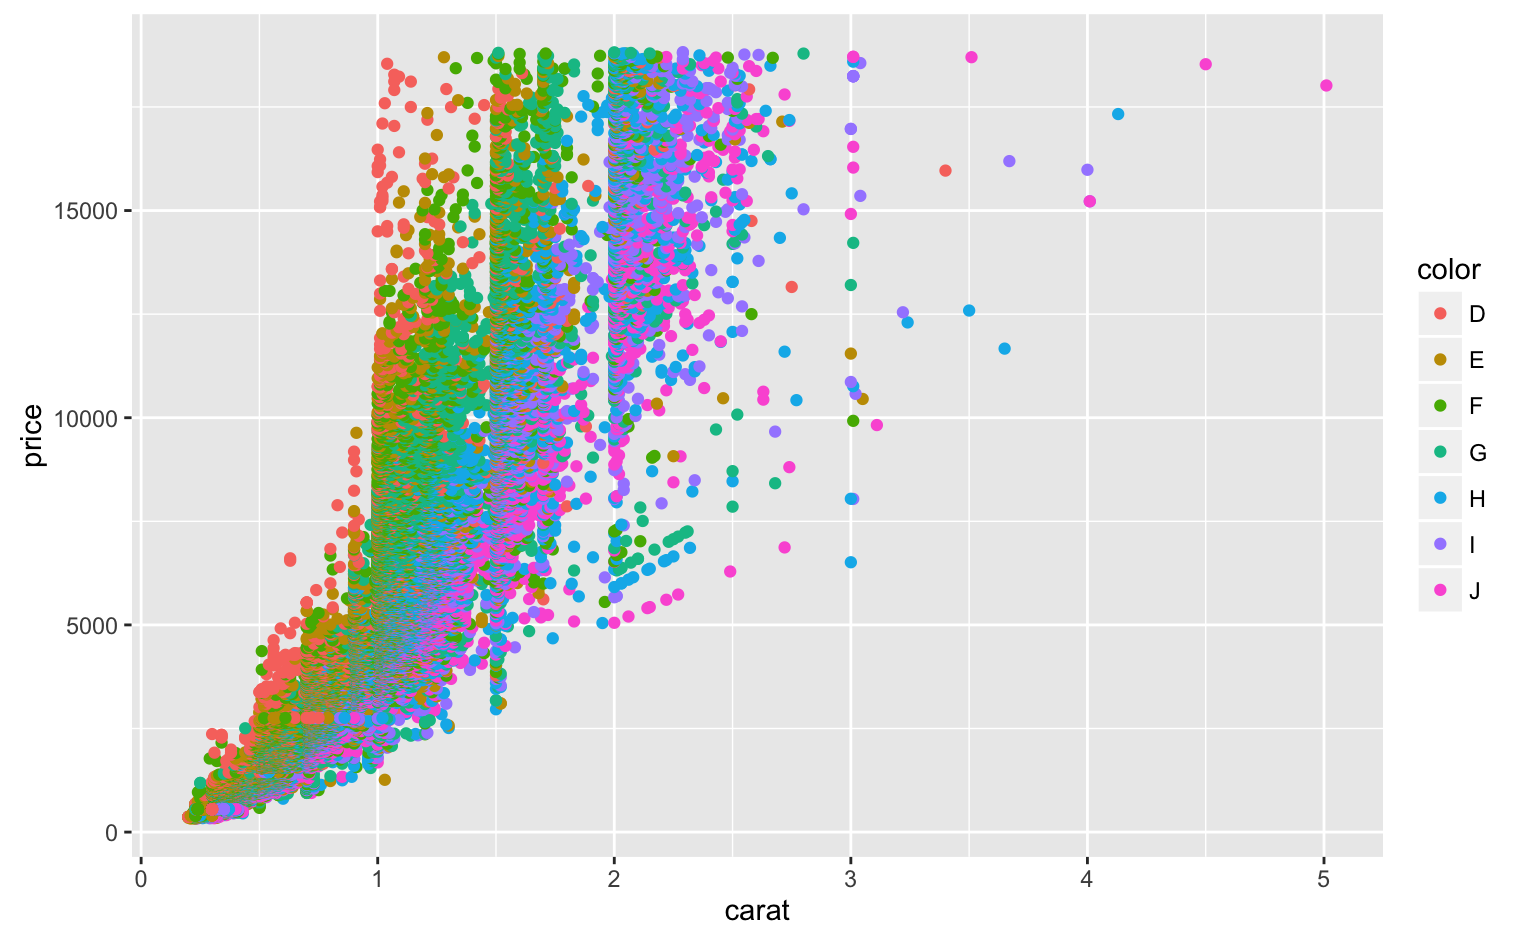
Faceting

#faceting
qplot(data = diamonds, price, 
      geom = "histogram", binwidth = 25, facets = .~color)

Your Turn

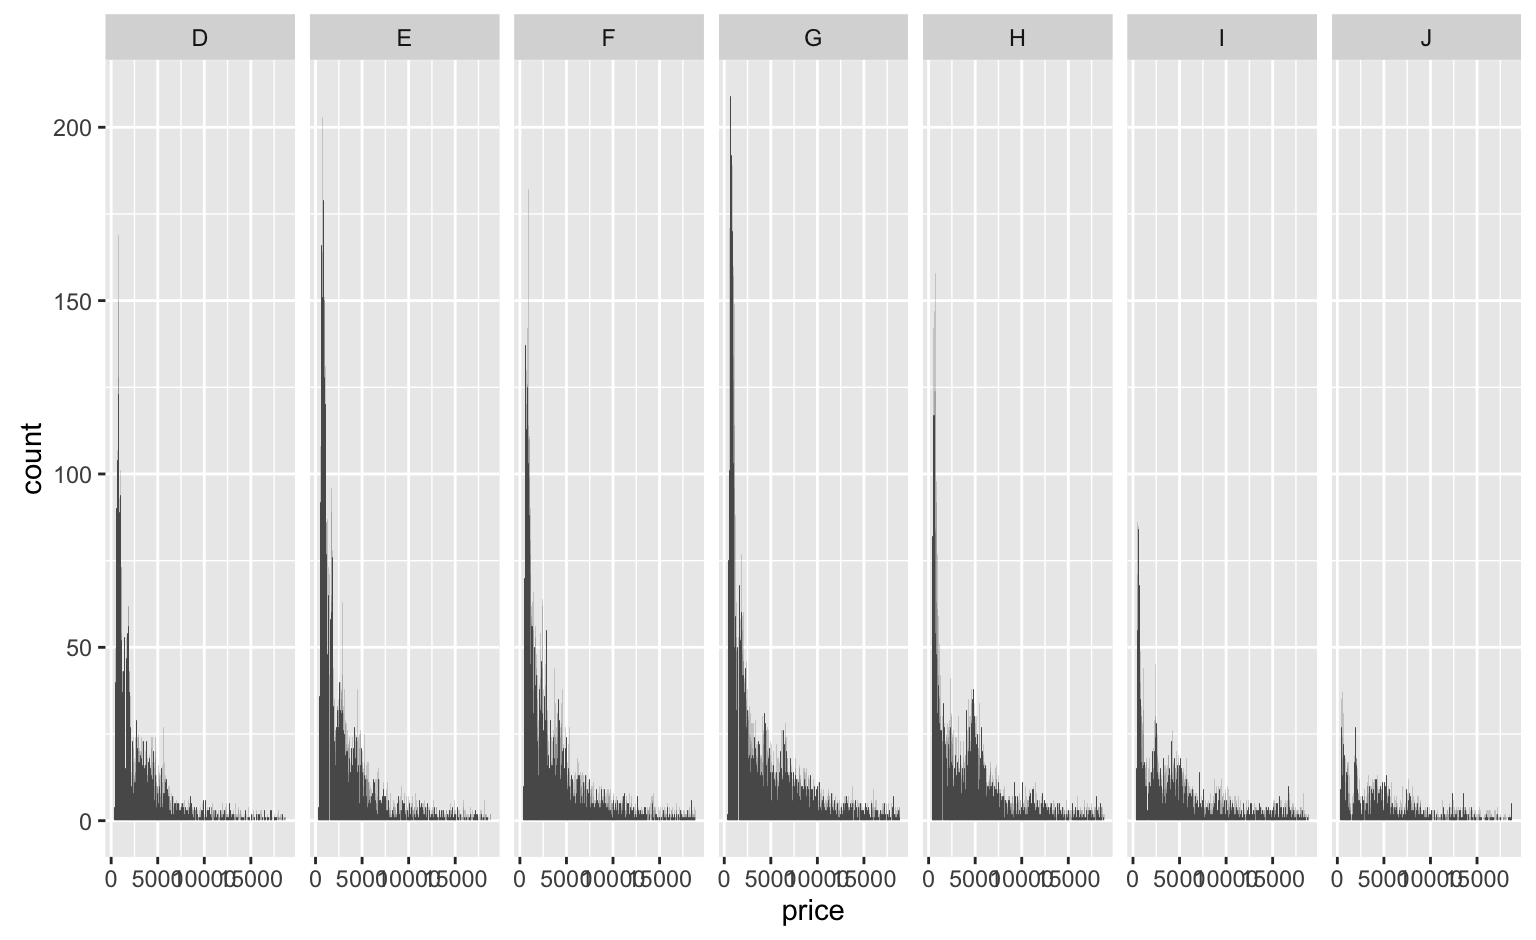
You will use the mpg dataset for all questions below.

  1. Make a histogram of highway gas mileage.
  2. Look at the distribution (histogram) of highway gas mileage by vehicle class.
  3. Make a plot to look at the relationship between city and highway gas mileage.
  4. Color your relationship plot by number of cylinders.
  5. What is the distribution of city gas mileage by manufaturer? Try a boxplot.