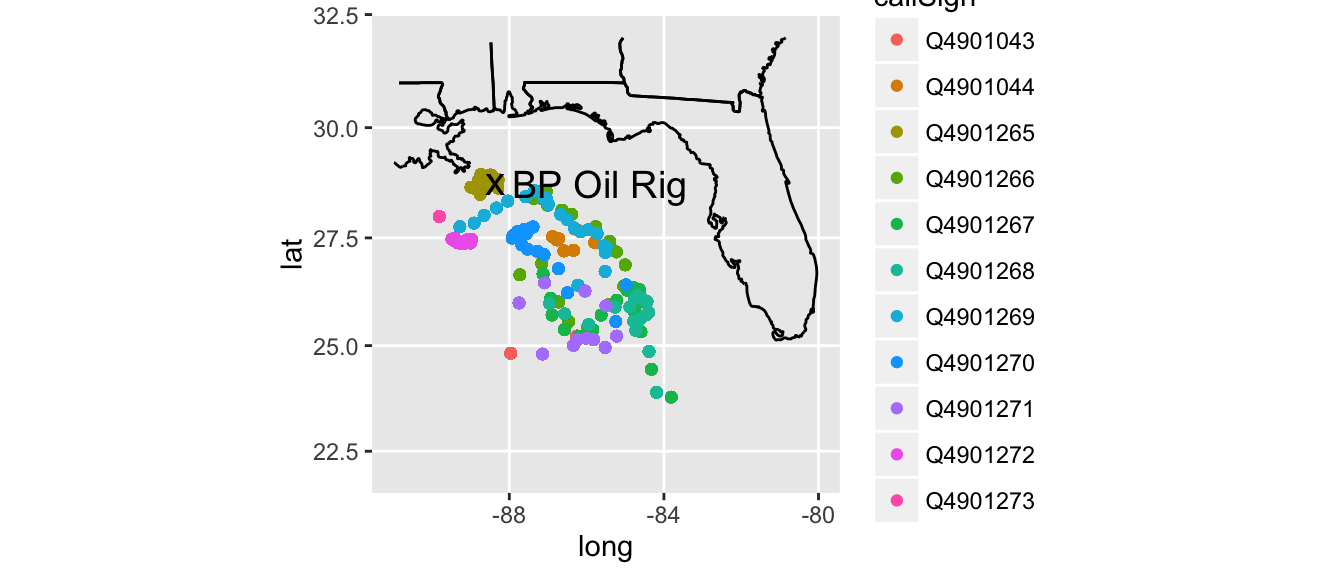
Layers

Ranae Dietzel and Andee Kaplan

What is a Layer?

A layer added ggplot() can be a geom…

… or a position adjustment to the scales

Layer Examples

Plot Geom Stat
Scatterplot point identity
Histogram bar bin count
Smoother line + ribbon smoother function
Binned Scatterplot rectangle + color 2d bin count

More geoms described at http://docs.ggplot2.org/current/

Piecing Things Together

Want to build a map using NOAA data

The Result

ggplot() +
    geom_path(data = states, aes(x = long, y = lat, group = group)) + 
    geom_point(data = floats, aes(x = Longitude, y = Latitude, colour = callSign)) +   
    geom_point(aes(x, y), shape = "x", size = 5, data = rig) + 
    geom_text(aes(x, y), label = "BP Oil Rig", size = 5, data = rig, hjust = -0.1) + 
    xlim(c(-91, -80)) + 
    ylim(c(22, 32)) + coord_map()

Your turn

  1. Read in the animal.csv data:
  2. animal <- read.csv("http://heike.github.io/rwrks/02-r-graphics/data/animal.csv")
  3. Plot the location of animal sightings on a map of the region
  4. On this plot, try to color points by class of animal and/or status of animal

ggplot is pipeable!

We can pass data as the first argument to ggplot()… meaning we can pipe to it!

Tidyverse FTW

library(tidyverse)
data(baseball, package="plyr")

baseball %>%
  filter(ab > 0) %>% #only players that have ever had an at bat
  group_by(year) %>%
  mutate(ba = h/ab,
         mean_ba = mean(h/ab)) %>%
  ggplot() +
  geom_point(aes(year, ba), alpha = .1) +
  geom_line(aes(year, mean_ba), colour = "blue")

French fries

During a ten week sensory experiment, 12 individuals were asked to assess taste of french fries on several scales (how potato-y, buttery, grassy, rancid, paint-y do the fries taste?)

French fries were fried in one of three different oils, and each week individuals had to assess six batches of french fries (all three oils, replicated twice)

Your turn

Using the tidyverse,

  1. Read in the french fry data:
  2. ff <- read.csv("http://heike.github.io/rwrks/03-r-format/data/frenchfries.csv")
  3. Change it from wide data to tall data (tidy-fy)
  4. Create boxplots of the values for each scale.
  5. Bonus: Facet by the oils