Grammar of Graphics
Posted by Rafael Martinez-Feria
Not exactly what I mean, but thanks anyway John!
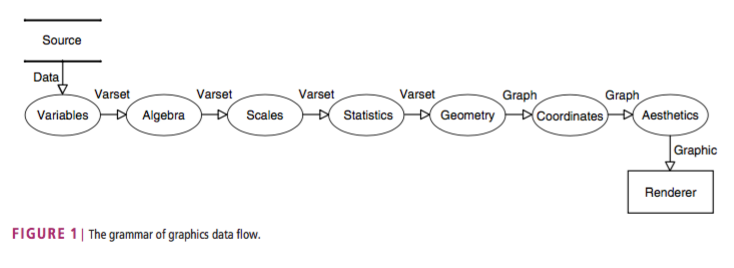
Grammar of grahics* (GoG) is the theory behing Hardly Wickam’s ggplot2 package. In his 2010 paper, Leland Wilkinson describes GoG as a system to produce a statistical graphics. The system contains seven GoG classes embedded in a data flow, which represent the sequence of mappings needed to a graphic from a set or multiple sets of data. The figure below (taken form Wilkinson’s paper) shows the data flow of the classes.
Here is an example of how GoG is implemented in ggplot2
require(ggplot2)
data("mtcars")- Variables maps data to an object called a varset (a set of variables). In ggplot2, for example, you can specify the varset that we want to use by using the data arguement
(p <- ggplot(data=mtcars))
2 and 3. Algebra and Scales are transformations on varsets. For instance, below we trasnform the scale of the x axis using scale_x_sqrt()
(p <- p + scale_x_sqrt())
- Statistics takes a varset and creates a statistical graph. Below the
stat_bin2d()function performs a summary of counting points within a 2d-bin statistic.
(p <- p + stat_bin2d(aes(x=mpg, y=hp)))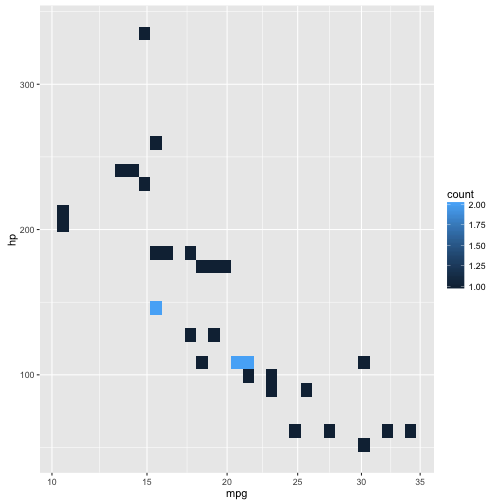
- Geometry maps a statistical graph to a geometric graph. Geometry is the “physiscal” graphic we want to see. For example below we add a point geometry to represent individual observations.
(p <- p + geom_point(aes(x=mpg, y=hp,colour=factor(cyl))))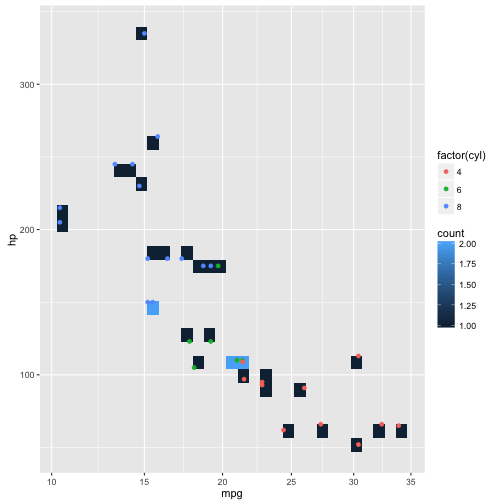
- Coordinates embeds a graph in a coordinate space. By default, ggplot2 uses cartesian coordinate system. But we can change it to polar coodinates, for example.
(p <- p + coord_polar())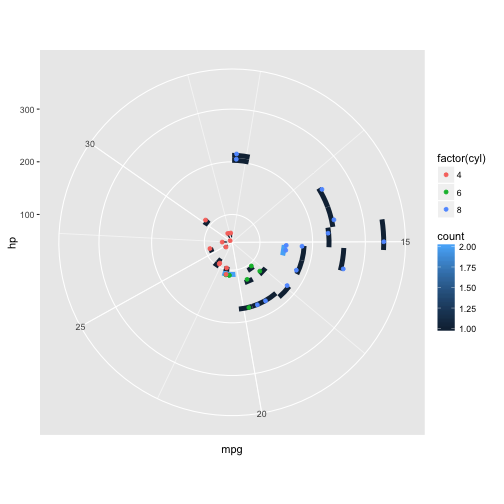
- Aesthetics maps a graph to a visible or perceivable display called a graphic. Note that in a few instances, we have used the
aes()function to tell ggplot what VARSET we want it to use to map the graph. In this example, we add a regresion line to a set of groups.
(p <- p + geom_smooth(aes(x=mpg, y=hp,colour=factor(cyl)), method = "lm"))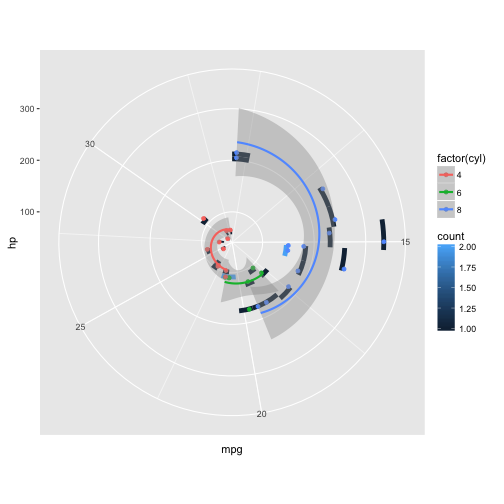
What are some challenges with GoG/ggplot2?
-
Becasue of its workflow (you have to run through GoG workflow every time) ggplot2 tends to be slower than other base graphic system.
-
It may sometimes be difficult to determine whether what you want to see in the graphic is an aesthetic, or a fixed values (takes a couple of tries to wrap your head around it).
-
Although tidy data works beautifully with ggplot2 (and the GoG paradigm), that means that you may need to invest sometime/code tiding your data. It is be harder to pass on to ggplot2 an
aes()if data is not tidy. You may end up having multiple geom layers.