dplyr, your new best fRiend

Ranae Dietzel & Andee Kaplan
dplyr, your new best fRiend
There is a dataset in the plyr package that has yearly batting records for major league baseball players from 1871 to 2007.
data(baseball, package="plyr")
head(baseball)
## id year stint team lg g ab r h X2b X3b hr rbi sb cs bb so
## 4 ansonca01 1871 1 RC1 25 120 29 39 11 3 0 16 6 2 2 1
## 44 forceda01 1871 1 WS3 32 162 45 45 9 4 0 29 8 0 4 0
## 68 mathebo01 1871 1 FW1 19 89 15 24 3 1 0 10 2 1 2 0
## 99 startjo01 1871 1 NY2 33 161 35 58 5 1 1 34 4 2 3 0
## 102 suttoez01 1871 1 CL1 29 128 35 45 3 7 3 23 3 1 1 0
## 106 whitede01 1871 1 CL1 29 146 40 47 6 5 1 21 2 2 4 1
## ibb hbp sh sf gidp
## 4 NA NA NA NA NA
## 44 NA NA NA NA NA
## 68 NA NA NA NA NA
## 99 NA NA NA NA NA
## 102 NA NA NA NA NA
## 106 NA NA NA NA NA
Write a for loop that calculates and stores the career batting average for each player (note, batting average is number of hits, h, divided by number of at bats, ab, in a player’s career.)
Hint: You can get the unique player ids using the following:
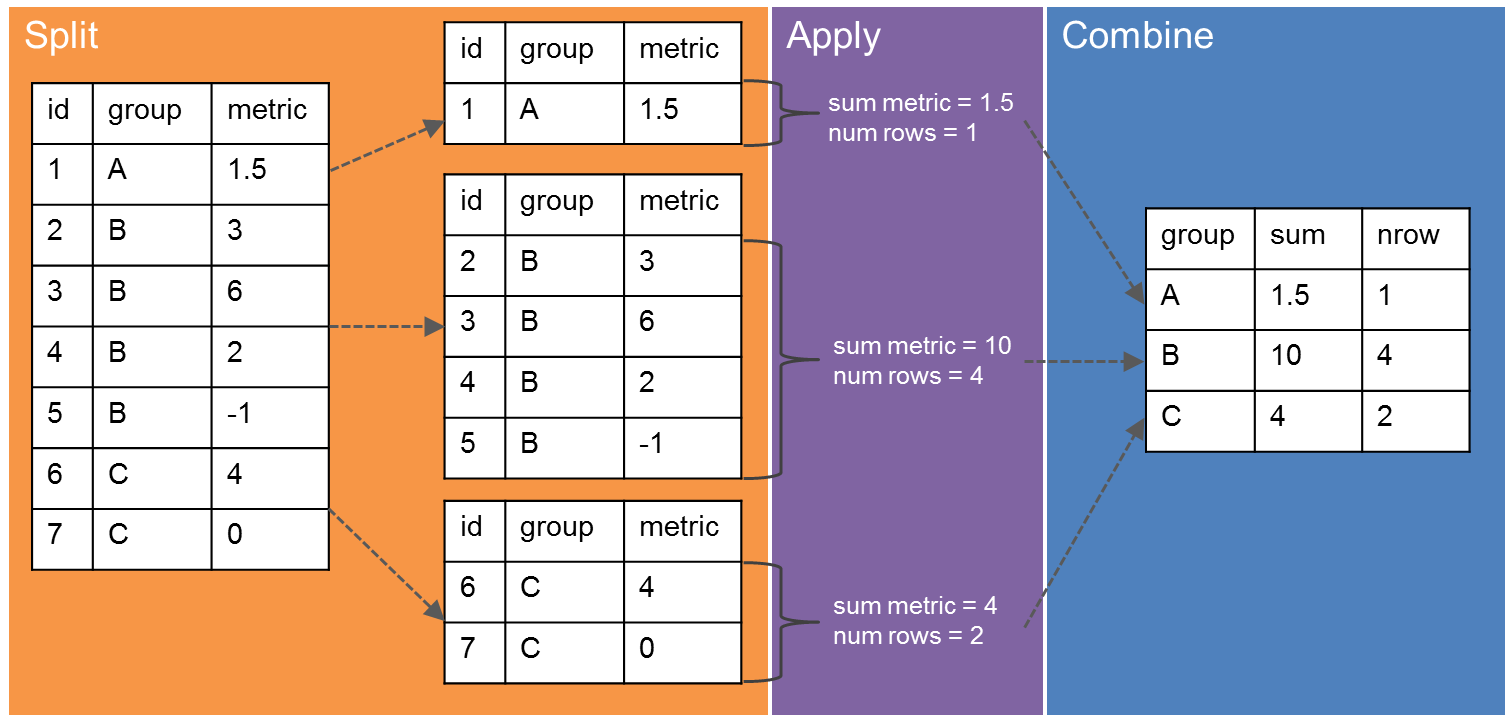
players <- unique(baseball$id)dplyrdplyr is a Hadley package that implements the “split-apply-combine” strategy (among other things).
library(dplyr)
dplyr provides simple verbs, functions that correspond to the most common data manipulation tasks, to help you translate those thoughts into code.
group_by() breaks down a dataset into specified groups of rows. When you then apply the verbs on the resulting object they’ll be automatically applied “by group”GROUP BYgroup_by(baseball, id)## Source: local data frame [21,699 x 22]
## Groups: id [1,228]
##
## id year stint team lg g ab r h X2b X3b
## * <chr> <int> <int> <chr> <chr> <int> <int> <int> <int> <int> <int>
## 1 ansonca01 1871 1 RC1 25 120 29 39 11 3
## 2 forceda01 1871 1 WS3 32 162 45 45 9 4
## 3 mathebo01 1871 1 FW1 19 89 15 24 3 1
## 4 startjo01 1871 1 NY2 33 161 35 58 5 1
## 5 suttoez01 1871 1 CL1 29 128 35 45 3 7
## 6 whitede01 1871 1 CL1 29 146 40 47 6 5
## 7 yorkto01 1871 1 TRO 29 145 36 37 5 7
## 8 ansonca01 1872 1 PH1 46 217 60 90 10 7
## 9 burdoja01 1872 1 BR2 37 174 26 46 3 0
## 10 forceda01 1872 1 TRO 25 130 40 53 11 0
## # ... with 21,689 more rows, and 11 more variables: hr <int>, rbi <int>,
## # sb <int>, cs <int>, bb <int>, so <int>, ibb <int>, hbp <int>,
## # sh <int>, sf <int>, gidp <int>summarise() summarises data through the use of aggregate functions, which take a vector of values and return a single number.min(), max(), mean(), sum(), sd(), median(), and IQR().summarise(baseball, mean(h))## mean(h)
## 1 61.7569summarise(group_by(baseball, year), mean(h))## # A tibble: 137 × 2
## year `mean(h)`
## <int> <dbl>
## 1 1871 42.14286
## 2 1872 42.92308
## 3 1873 68.53846
## 4 1874 64.86667
## 5 1875 73.29412
## 6 1876 72.40000
## 7 1877 64.23529
## 8 1878 66.82353
## 9 1879 82.32000
## 10 1880 72.00000
## # ... with 127 more rows